- Events
- Homepage
Data Skills Workshop: Data Analysis – Reproducible Research in R
In this workshop, you will learn how to recognize the issues that reproducible research helps address. Then you will learn the important roles of documentation, sharing, automation and organization in making research reproducible. You will be introduced to the tools (R/RMarkdown/Git and GitHub) that can be used to make your research reproducible. Please note: All
2020 Rural Symposium
The Rural Symposium is an annual opportunity for University of Guelph graduate students to showcase their rural research to policy makers, policy analysts and program staff from the Ontario Ministry of Agriculture, Food and Rural Affairs (OMAFRA). The event facilitates knowledge mobilization and network building between graduate students at the University of Guelph, researchers, OMAFRA,
P4E Job Fair 2020
Students from all disciplines and across all semester levels are welcome to network with over 200 employers from diverse sectors at the P4E (Partners4Employment) Job Fair. You don't want to miss this job fair...it's the largest of its kind in the country! Free admission with student or alumni ID from sponsoring schools. Free shuttle buses
Black History Month: RISE Spoken Word
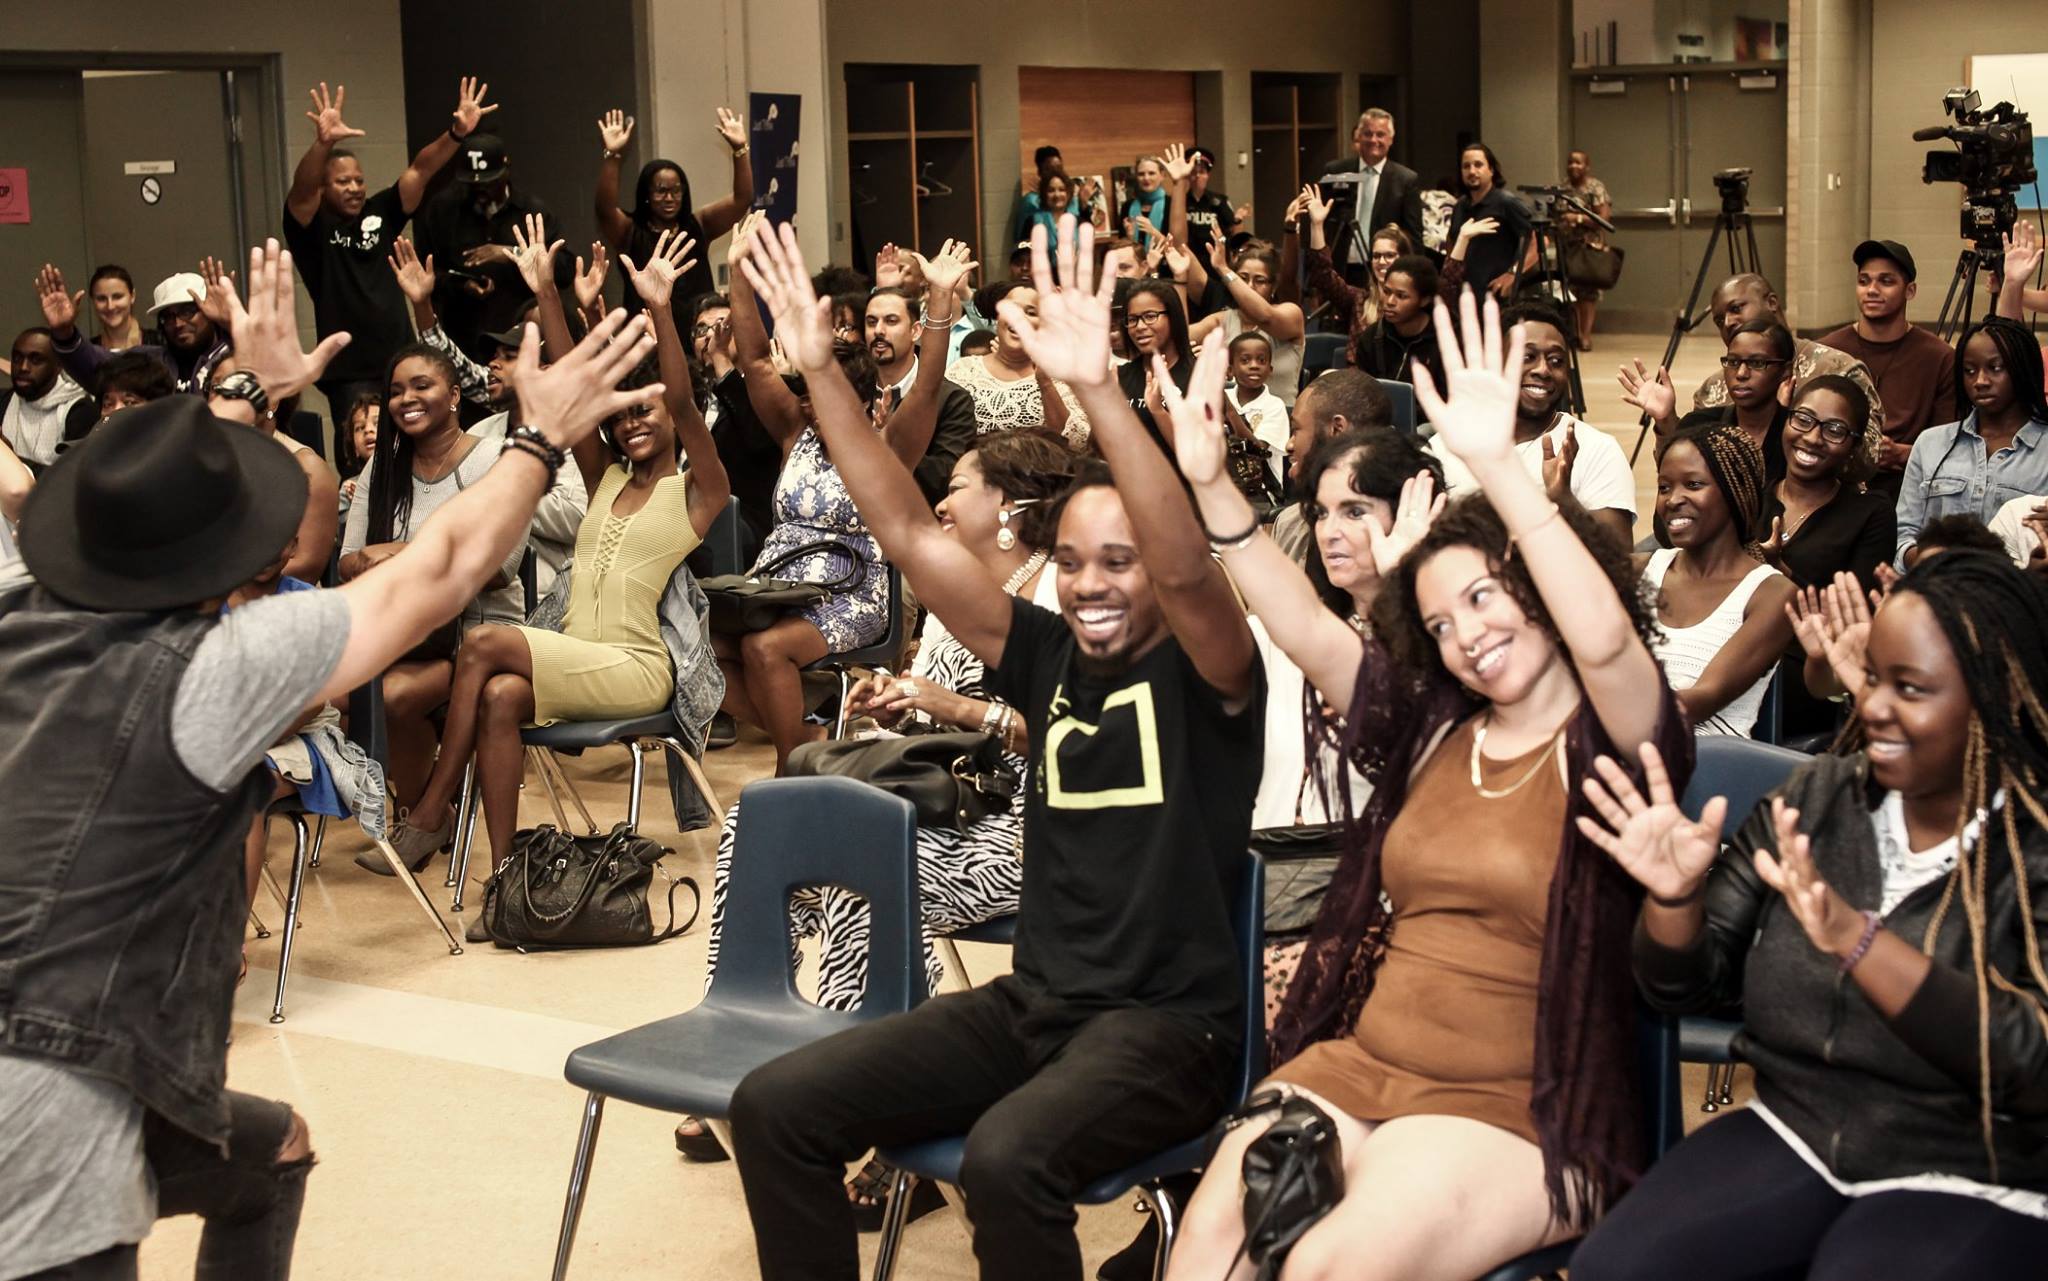
During Black History Month, join us for a special performance by Reaching Intelligent Souls Everywhere (RISE) - the youth-led community movement composed of artists, activists and revolutionaries. Together they create a safe and welcoming platform for self-expression and healing through the performance arts. See more Black History Month events supported by U of G. Presented
Faculty: IT Strategy Workshop – Help Us Help You!
Are you a faculty member or researcher at U of G? Do you have ideas to improve teaching, learning orresearch through IT? The IT strategy team wants to hear from you! Sessions are Feb. 5 and 13. Contact ITstrategy@uoguelph.ca for more information.
Data Skills Workshop: Data Visualization – R using ggplot2
In this workshop, you will learn how to produce scatter plots, boxplots and time series plots using ggplot2. Also, you will learn the tools and knowledge to create any figure/graphic to describe your data and customize your graphics with titles, legends, colors, etc. This workshop is aimed at individuals who conduct statistical analysis. Advanced knowledge
Landscape Architecture Guest Lecture: George Dark
George Dark, FCSLA, FASLA, OALA, is the recipient of the Governor General's Medal in Landscape Architecture and is a Senior Design Partner at Urban Strategies Inc. George's talk is titled "Density." All are welcome to attend.
Data Skills Workshop: Data Visualization – Excel
Excel is a popular tool that provides many powerful features that can assist you in managing your data and help to better understand small and large data sets. While not as robust as other data visualization tools, it can be used for visualizing your data through its charting features. Come learn how to create charts
Uncharted: Mental Health Awareness Speaking Tour with Daniel Carcillo
**FREE ADMISSION** - No registration required Ducky Brand presents Uncharted: A mental health awareness speaking tour On Feb. 6, two-time Stanley Cup champion and mental health advocate Daniel Carcillo presents "Uncharted: A Mental Health Awareness Speaking Tour." About this Event: Hear former Chicago Blackhawk Daniel Carcillo tell his story of how mental illness affected his
Brain Food Workshop: Outlining Your Thesis and Explaining Your Research Findings
In this workshop session, we analyze the common features and structures of the thesis/dissertation and then focus more specifically on the results and discussion sections. If possible, please bring your laptop to this workshop. Outlining Your Thesis This session offers a visual mapping strategy that you can use to organize your research and writing, structure
Data Skills Workshop: Data Analysis – SAS Part 1
Look and feel like a pro with SAS! SAS is a statistical software package that is widely used in many disciplines. In just three hours you will be ready to impress friends and family with this easy to use software. You will learn how to: Maneuver in the SAS interface (part 1) Import data (Part
Data Skills Workshop: Data Analysis – Python
In this workshop, you will learn how to run descriptive statistics, perform simple statistical analysis including ANOVA and correlation. This is a great opportunity for students to learn how to analyze their own data, which is becoming an extremely valuable skill in research, academia and the workplace. Please bring a laptop with your own use
The Beginner’s Guide to Animated Videos Workshop
Animated videos are a great way to engage your audience, share information and make information more "digestible." This session will provide instruction on free animation software called PowToon that is quick and easy to use. Learn tips and tools to plan and storyboard your video, write your script and make your video accessible. After this
Introduction to Citation Management Workshop
This presentation will walk you through the benefits of citation management and explain how you can use citation managers to keep track of your research and speed up the citation process. Participants are required to bring a laptop to the session. We will focus on using Zotero and Mendeley and recommend you come with them
Data Skills Workshop: Data Analysis – SAS Part 2
Look and feel like a pro with SAS! SAS is a statistical software package that is widely used in many disciplines. In just three hours you will be ready to impress friends and family with this easy to use software. You will learn how to generate descriptive, exploratory and simple inferential statistics. Please note that
Data Skills Workshop: Data Analysis – Qualitative analysis using NVivo
NVivo is a qualitative data analysis (QDA) computer software package designed to help you manage and analyze qualitative data. In this workshop, we will work on bringing your sources in, creating nodes, coding and running queries. Please bring a laptop for your own use during the workshop with the latest version of NVIVO installed. Please
Black History Month: Noon Hour Concert – Lydia Persaud
During Black History Month, enjoy a noon hour concert featuring Lydia Persaud. A fixture of Toronto’s music community and a sought-after collaborator, Lydia Persaud stands alone with her debut album Let Me Show You, released on Next Door Records. A seasoned musician and member of renowned Toronto bands Dwayne Gretzky and The O’Pears, Lydia's work
Skills for Research Impact: Social Media Engagement
Learn all about the web 2.0! Discover how to choose social media platforms that are appropriate for your goals and audiences, and get tips on creating engaging posts.
Black History Month: Artist Talk with Sandra Brewster
During Black History Month, join us as Sandra Brewster conducts a walkthrough of her exhibit Token | Contemporary Ongoing, touching on themes of migration, representation and diaspora that emerge both in her Art Gallery of Guelph exhibit and her overall practice. See more Black History Month events supported by U of G.
Data Skills Workshop: Data Analysis and Visualization – Intro to GIS Part 1
ArcGIS is a Geographic Information System (GIS) - a software program for working with maps and geographic data. A GIS allows you to work with any data that you know a location for (e.g., addresses, latitude/longitude, census locations, name of a place, etc.). ArcGIS is available on all library computers, also by download to the


